
Keyword
Earth Science | Oceans | Ocean Chemistry | Chlorophyll
241 record(s)
Type of resources
Topics
Keywords
Contact for the resource
Provided by
Formats
Update frequencies
Status
draft
-
This record contains data collected from the near-water surface sampling site off the Lucinda Jetty, as part of the Lucinda Jetty Coastal Observatory. Sample collection began the 9th of January, 2014. The data can be used for Ocean Colour sensor validation. Parameters measured include the absorption coefficients of the particulate and dissolved components of the water column and the phytoplankton pigment concentration and composition.
-
ESRI grid showing ocean primary production extracted from global observations of ocean colour data from the moderate resolution imaging spectroradiometer (MODIS). This grid has been produced by CSIRO for the National Oceans Office, as part of an ongoing commitment to natural resource planning and management through the 'National Marine Bioregionalisation' project. Chlorophyll accuracy is about ± 20%.
-
ESRI grids showing ocean chlorophyll from global observations of ocean colour data from the moderate resolution imaging spectroradiometer (MODIS). These grids have been produced by CSIRO for the National Oceans Office, as part of an ongoing commitment to natural resource planning and management through the 'National Marine Bioregionalisation' project. Chlorophyll accuracy is about ± 20%.
-
This data set contains the MODIS Aqua ocean colour satellite data from the period December 2002 to January 2004. The data are received as monthly composites, with a 4 km resolution, and are constrained to the region between 90E and 180E, and 10N to 60S. The data set is a level 3 product, where the chlorophyll accuracy has been assessed and the uncertainties in the product well established in a systematic and statistically robust way representing global rather than regional conditions. The data was sourced from http://modis.gsfc.nasa.gov/. The data are in hdf format, and consist of 96 files totaling approximately 850 MB. The Moderate Resolution Imaging Spectroradiometer (MODIS) administered by NASA Goddard Space Flight Center, is a 36-band spectroradiometer measuring visible and infrared radiation and obtaining data that are being used to derive products ranging from vegetation, land surface cover, and ocean chlorophyll fluorescence to cloud and aerosol properties, fire occurrence, snow cover on the land, and sea ice cover on the oceans, from a continuous global coverage every 1 to 2 days. The first MODIS instrument was launched on board the Terra satellite in December 1999.
-
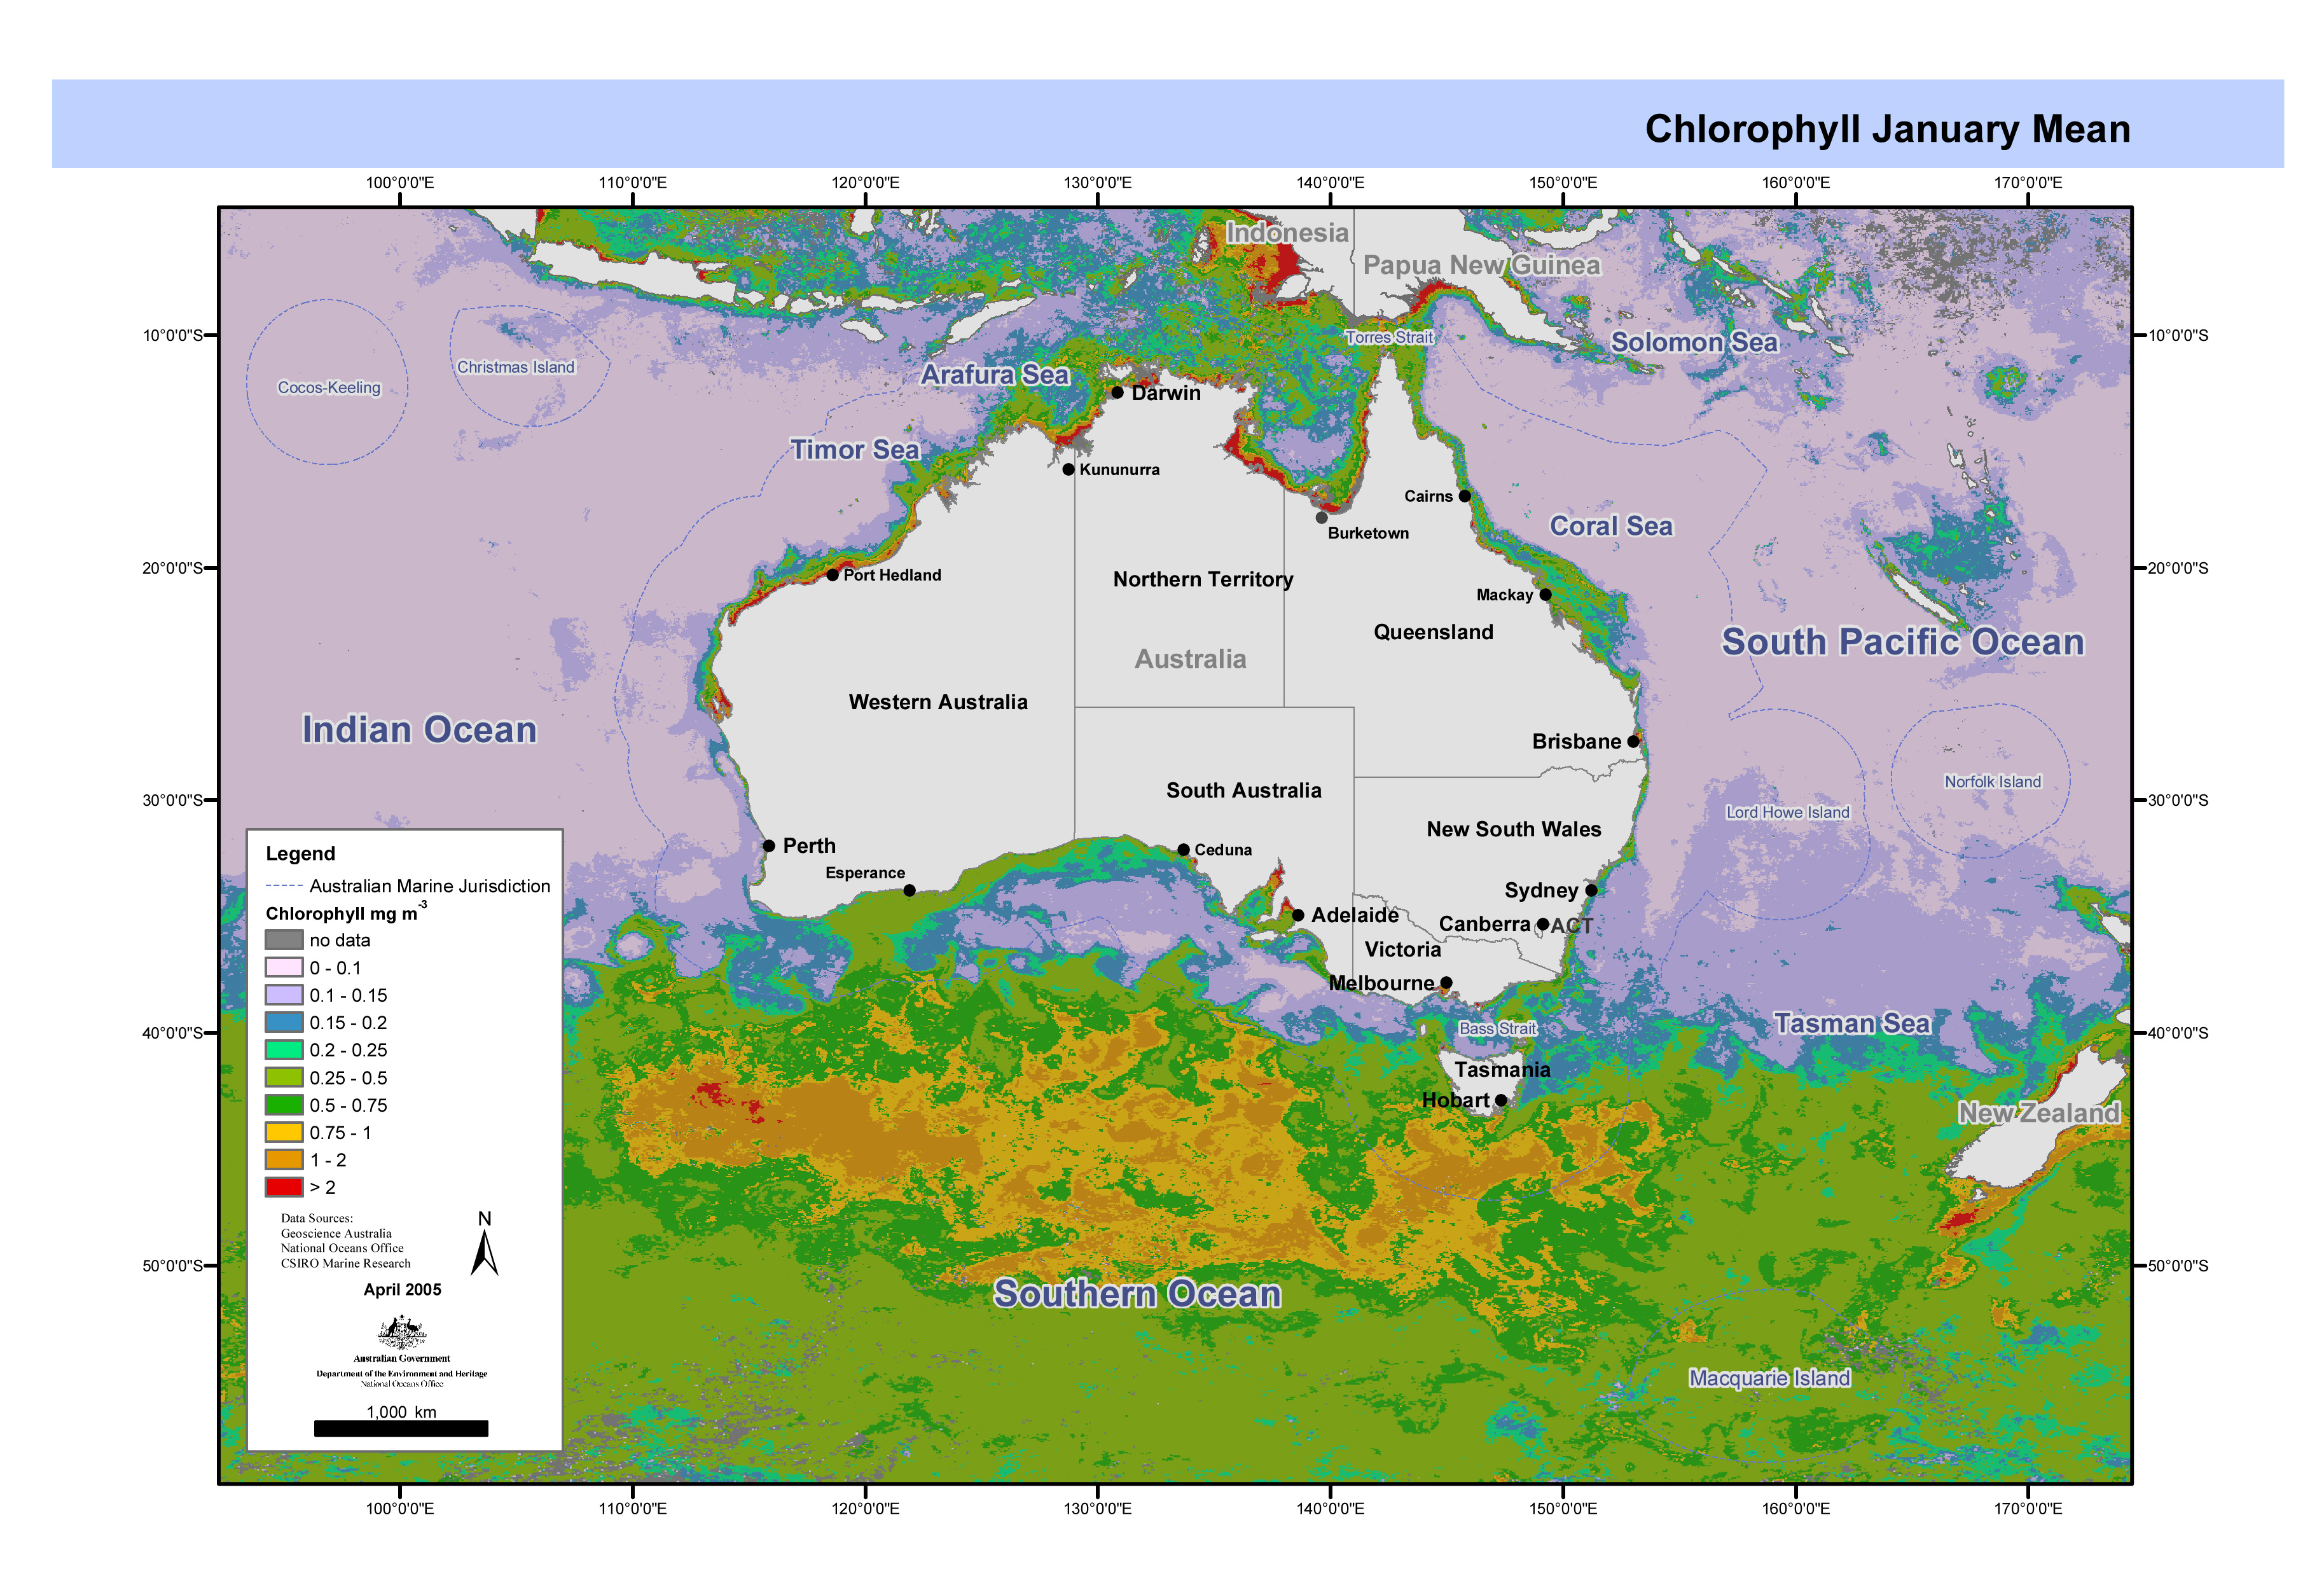
Set of 4 maps showing quarterly means of ocean colour data from the moderate resolution imaging spectroradiometer (MODIS). These maps have been produced by CSIRO for the National Oceans Office, as part of an ongoing commitment to natural resource planning and management through the 'National Marine Bioregionalisation' project.
-
Primary productivity point data from Australian waters that has been mapped using MapInfo. Data collected from oceanographic surveys conducted between 1959 and 1964 onboard the vessels "Gascoyne" and "Diamantina". Primary Production integrated to 100m grams Carbon per square metre per day. These Mapinfo layers have been produced by CSIRO for the National Oceans Office, as part of an ongoing commitment to natural resource planning and management through the 'National Marine Bioregionalisation' project. Variations in onscreen colour representation or printed reproduction may affect perception of the contained data.
-
KSN Project 2.2.2 provides key information on the oceanographic and biological forcing associated with nutrient supply that determines the near-shore productivity of the Kimberley region, and links these with higher trophic levels. Key objectives of the research were - To make new estimates of pelagic primary productivity, identifying the key physical and community processes driving production in the region. - To better describe the phytoplankton and zooplankton communities in coastal waters of the Kimberley, to determine the trophic linkages within these communities and to identify the key factors controlling pelagic secondary productivity. - To integrate these parameters into an extensible biogeochemical modelling framework, allowing predictive linkages between physical and biological processes in the region. This metadata records specifically relates to modelling aspects of the project completed by CSIRO. The data originates from a number of model simulations conducted between 3/1/2010 to 21/12/2010. All field data are held at Pawsey and RV Southern Surveyor and RV Solander.
-
Ocean net primary production (ONPP) is defined as the rate of inorganic carbon uptake into the ocean biosphere, minus respiration. Biological processes, chiefly photosynthesis, can remove carbon from the dissolved inorganic ocean reservoir, providing an important potential sink for atmospheric carbon. This carbon flux into the ocean biosphere constitutes the base of the pelagic marine food web, directly affecting fishery productivity (Behrenfeld et al., 2002). As part of the Earth Observing System (EOS) science activities at Goddard Space Flight Center (GSFC), the National Aeronautics and Space Administration (NASA) is applying models to remote sensing data from the Moderate Resolution Imaging Spectroradiometer (MODIS), aboard the Terra and the Aqua spacecraft, to compute two indices of ONPP. The key model input data for the ONPP models are 8 day (weekly) composite averages of the MODIS semi-analytic chlorophyll product (Chlor_a_3) and the MODIS daytime sea surface temperature (D1) in Integerized Sinusoidal Equal Area Grid (ISEAG) projection, at 4.63 km resolution. Both models also use photosynthetically available radiation (PAR) is derived from surface incident short-wave surface flux estimates provided by NASA's Data Assimilation Office (DAO). The PAR, which is provided in one degree, unprojected global observations for every 3 hours, is averaged over the MODIS weekly period of eight days. For the P2 model only, daily synoptic mixed-layer depth (MLD) at one degree resolution is provided by the U.S. Navy's Fleet Numeric Meteorology and Oceanography Center, and also averaged to the MODIS weekly period. This was extracted from http://modis.gsfc.nasa.gov/data/atbd/atbd_mod19.pdf being the parts relevant to the 4km mapped modis monthly mean chlorophyll, K_90, suspended solids and sea surface temperature data. MODIS datasest are routinely recalibrated as data collection algorithms and seasonal biases are refined by NASA over time.
-
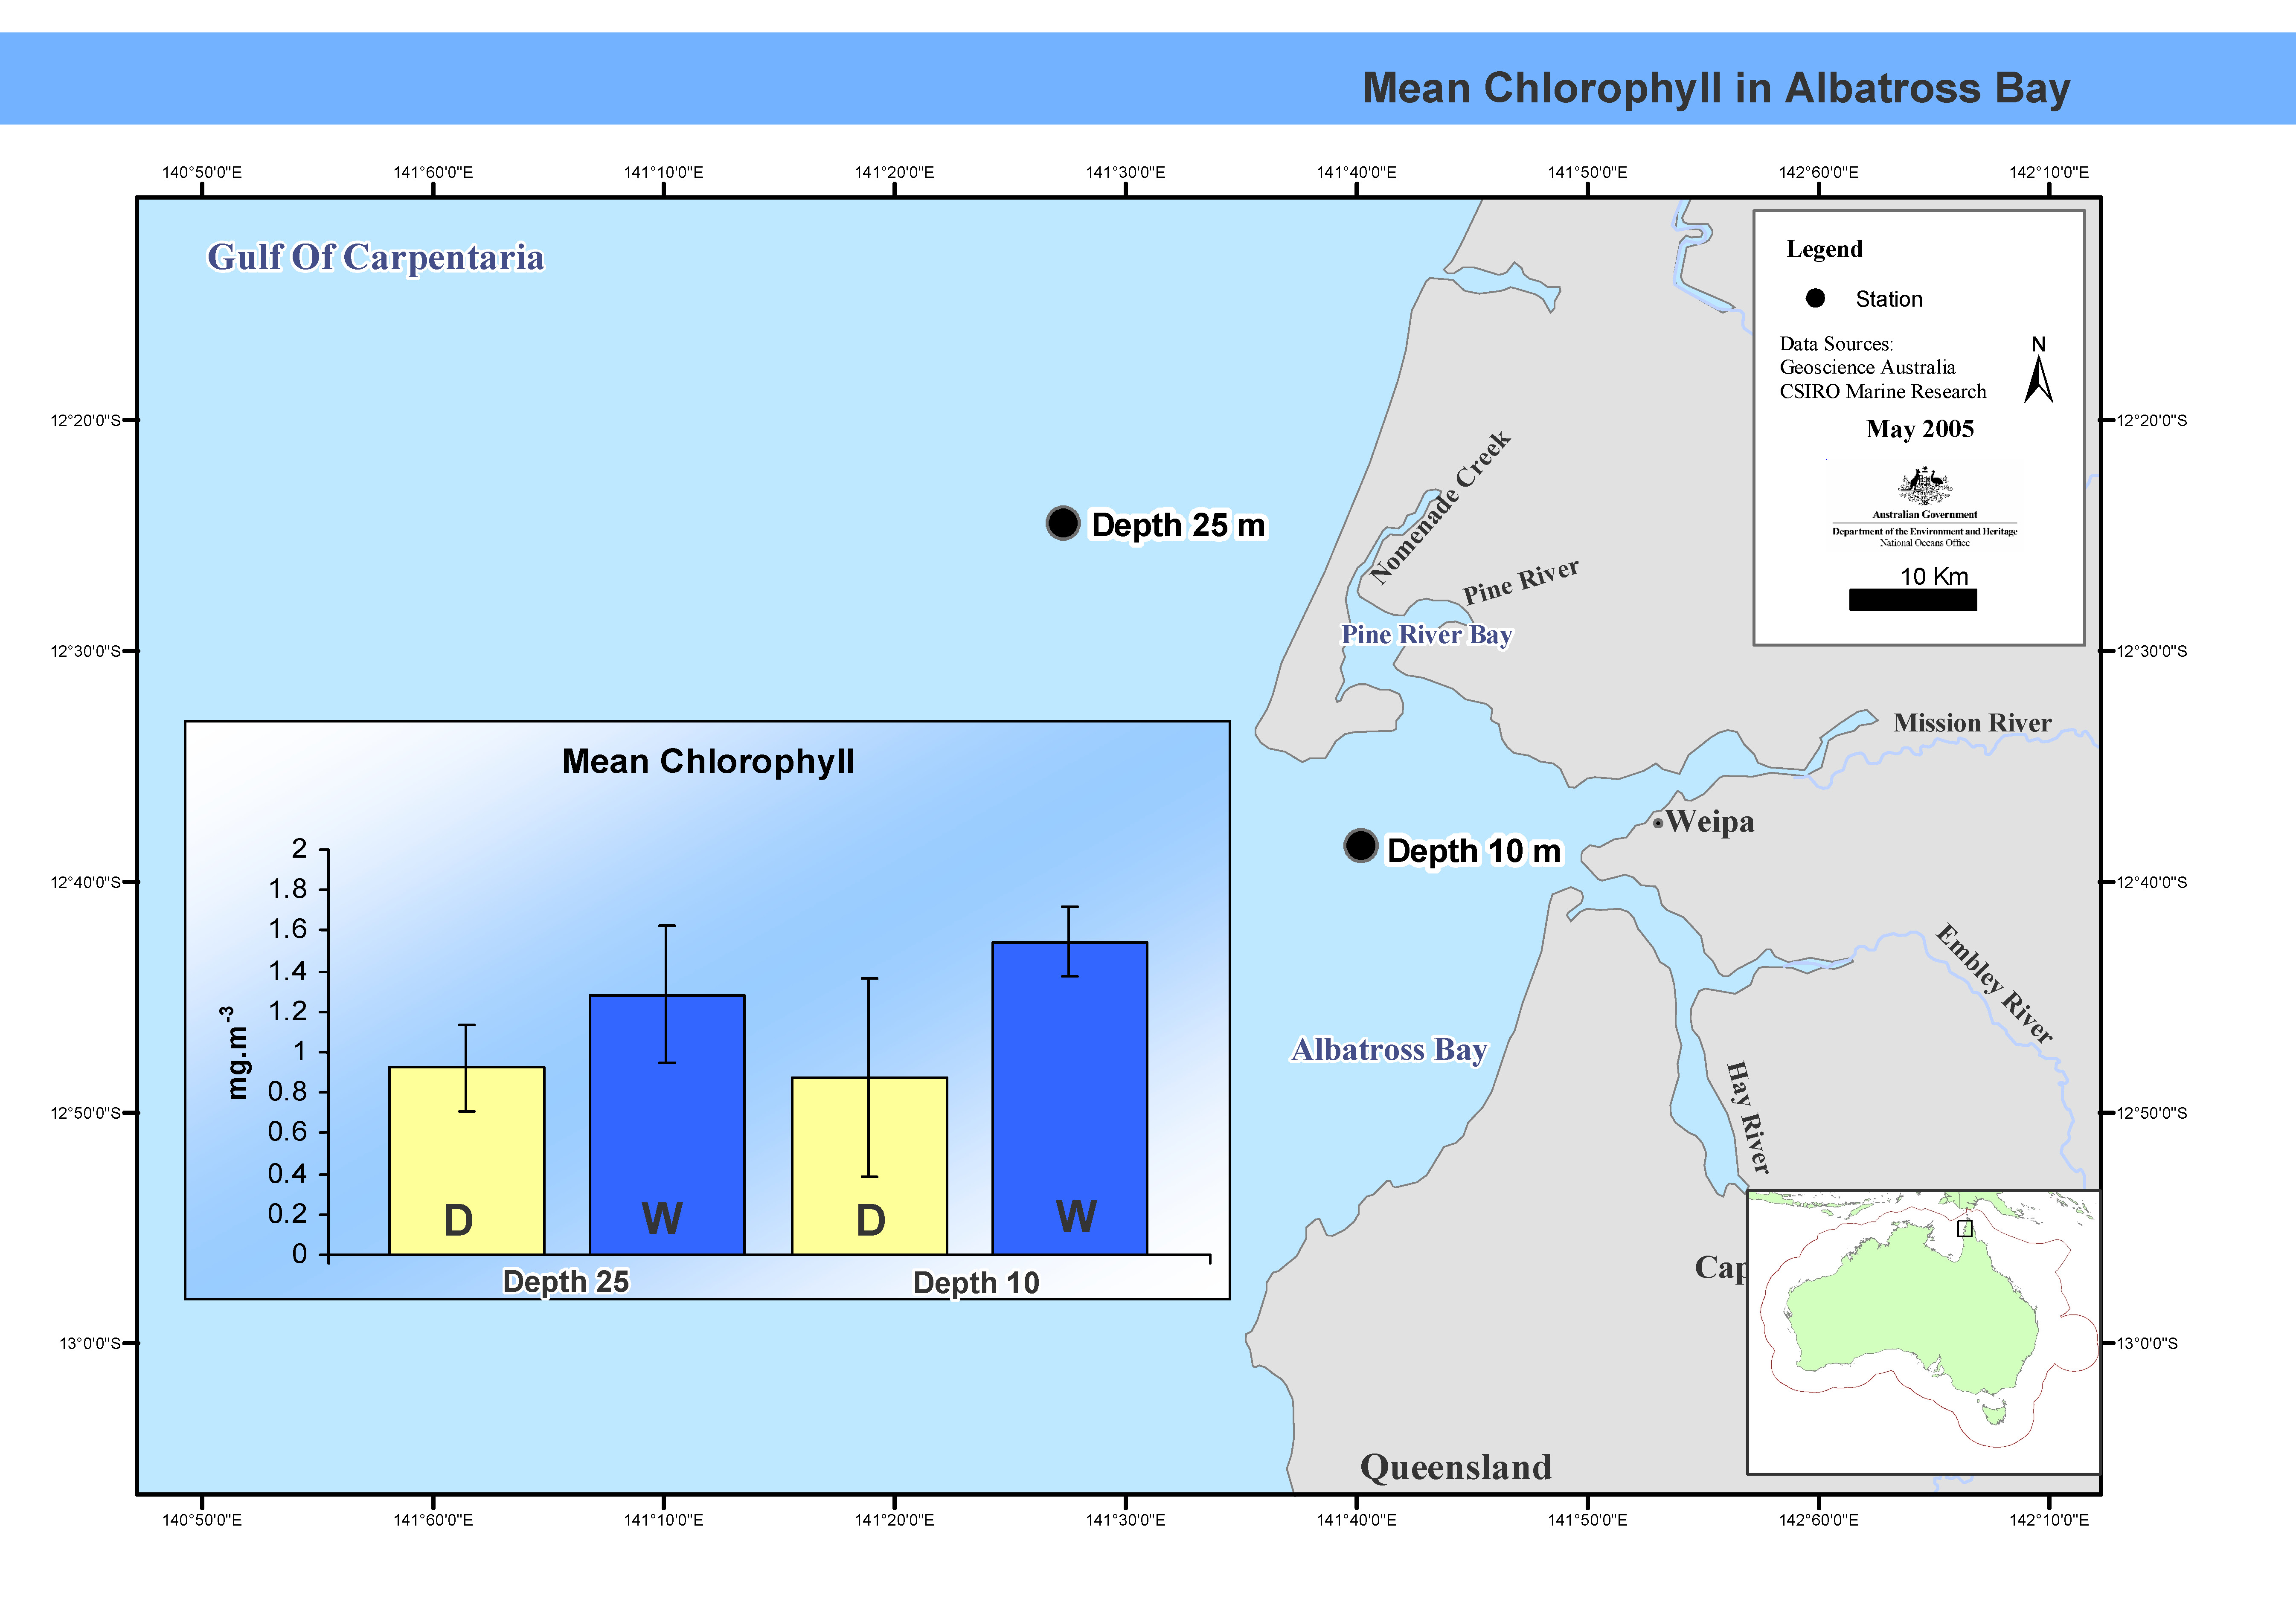
This map shows mean chlorophyll concentrations in Albatross Bay. Between February 1988 and February 1992 the FRV Jacqueline D completed nine cruises, seven in summer, two in winter, in Albatross Bay in the north-east Gulf of Carpentaria. Two stations, one 10m deep, the other at 25m, were sampled. Mean chlorophyl levels and primary productivity in the water column were measured. This map has been produced by CSIRO for the National Oceans Office, as part of an ongoing commitment to natural resource planning and management through the 'National Marine Bioregionalisation' project.
-
Zooplankton biomass point data from southern Australian waters that has been mapped using MapInfo. Data collected from oceanographic surveys conducted between 1959 and 1964 onboard the vessels "Gascoyne" and "Diamantina". These MapInfo layers have been produced by CSIRO for the National Oceans Office, as part of an ongoing commitment to natural resource planning and management through the 'National Marine Bioregionalisation' project. Variations in onscreen colour representation or printed reproduction may affect perception of the contained data.